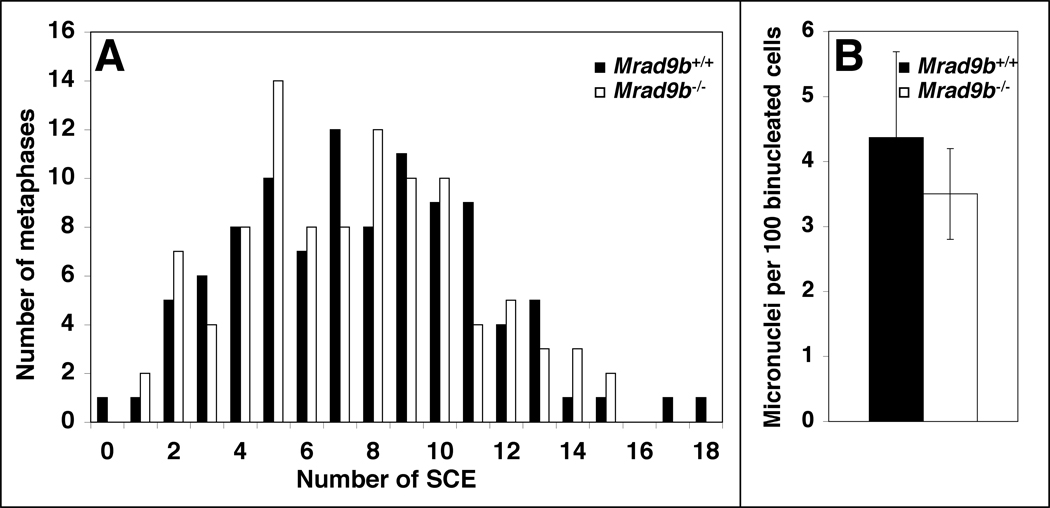
Figure 7.
Genomic stability of Mrad9b+/+ and Mrad9b−/− ES cells. (A) Spontaneous sister chromatid exchange (SCE) in Mrad9b+/+ (black columns) and Mrad9b−/− (white columns) ES cells. The spread of numbers of SCEs per given number of metaphases in Mrad9b+/+ versus Mrad9b−/− ES cells is not significantly different as calculated by the F-test for homogeneity of variance (p=0.6). (B) Spontaneous micronuclei formation in Mrad9b+/+ (black bar) and Mrad9b−/− ES cells (white bar). Cell division was blocked after one cycle with cytochalasin B and micronuclei were scored. Data are the mean of three experiments. Bars indicate standard deviation. There is no significant difference between the number of micronuclei in Mrad9b+/+ versus Mrad9b−/− cells as calculated by the Student’s t-test (p=0.4).

