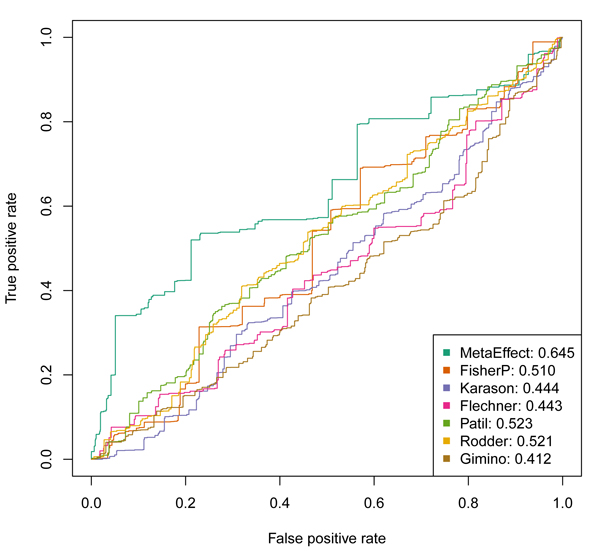
Figure 2.
Receiver Operating Characteristics (ROC curves) showing the relative ability of the meta fold-changes and the meta p-values to prioritize genes associated with "IMMUNE RESPONSE" as identified in the Molecular Signatures Database. The ability of individual studies to identify/prioritize genes is also shown, indicated by the last name of the first author of the associated publication. In the figure legends, the different sources of the ROC curves are indicated by different colors and the area under the curve is shown to the right of the label. The greater the area under the curve, the great predictive power to identify genes involved in immune response. Note that the meta fold-change (indicated by MetaEffect for the meta effect estimate approach) has the greatest predictive power. The Fisher's method (FisherP) meta p-values do better than most of the single experiments, but are completely dominated by the meta fold-change.

