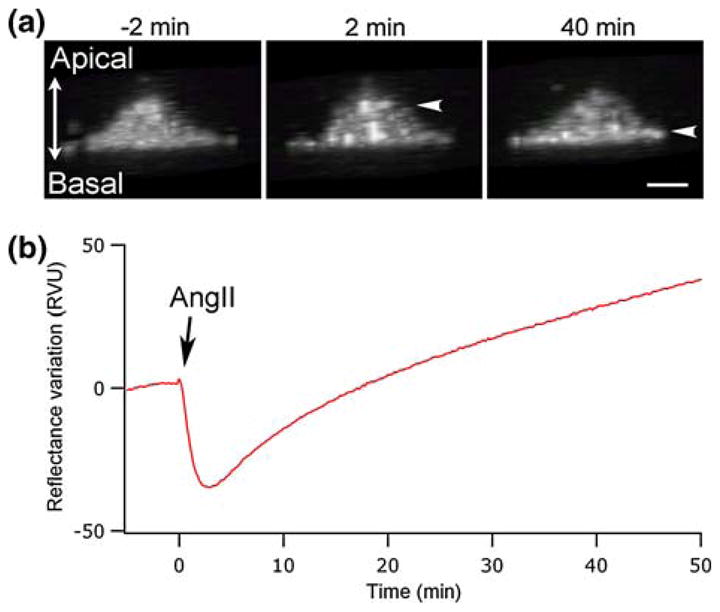
FIGURE 4.

Confocal imaging of HEK-293 cells, transfected with GFP-actin, in relation to the SPR signal. (a) Confocal transversal view of an individual cell, constructed from 55 sections of 250 nm. Micrographs are presented at selected times before and after AngII stimulation (−2, 2 and 40 min). (b) SPR signal associated with the stimulation of cells by 100 nM AngII. The scale bar corresponds to 10 μm.
