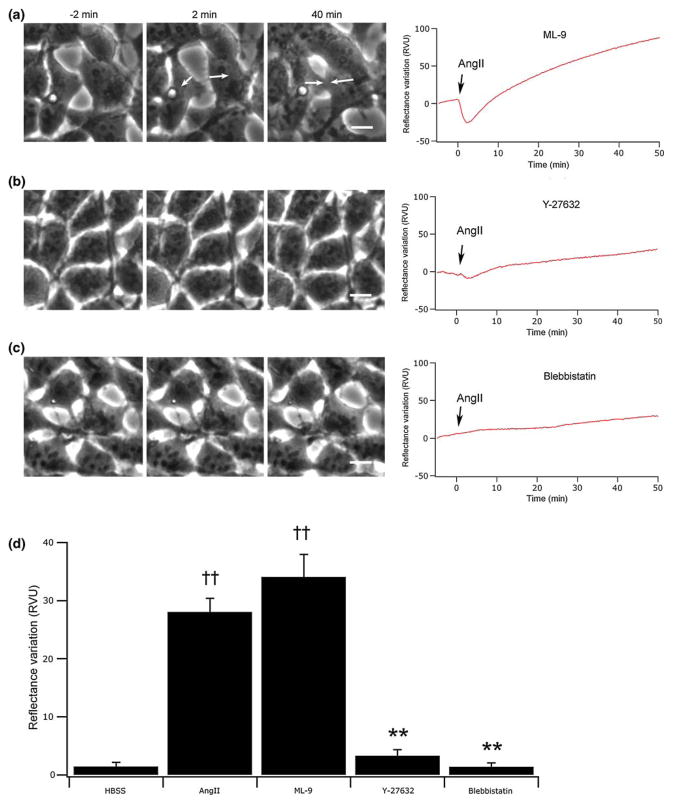
FIGURE 5.
Implication of signaling pathways influencing the actin cytoskeleton in the SPR signal variation. In (a), (b) and (c) are presented phase-contrast micrographs recorded before (−2 min) and after AngII stimulation (2 and 40 min) for cell treatment with inhibitors targeting respectively the MLCK (20 μM, ML-9), RhoK (10 μM, Y-27632) or directly the actomyosin contraction (100 μM, blebbistatin). (d) Summary of the amplitudes in the initial decrease of the SPR signal (n = 5). ††p<0.01 versus HBSS stimulation, **p<0.01 versus AngII stimulated cells. The scale bars correspond to 10 μm.

