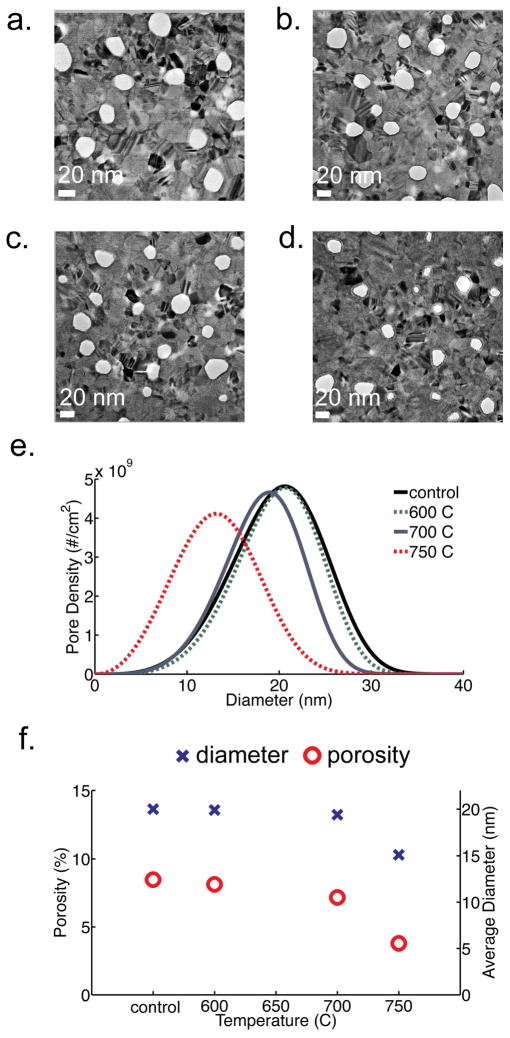
Figure 2.
TEM images of carbonized membranes at different temperatures: (a) untreated, (b) 600°C, (c) 700°C, (d) 750°C. Scale bar is 20 nm. A 10% acetylene in argon mixture was used with a five minute soak time. (e) Pore size distribution as calculated from TEM images (f) Graph showing size (blue ‘X’) and porosity dependence (red ‘O’) with soak temperature. The standard deviation of porosity and diameter is 0.25% and 0.5 nm, respectively.

