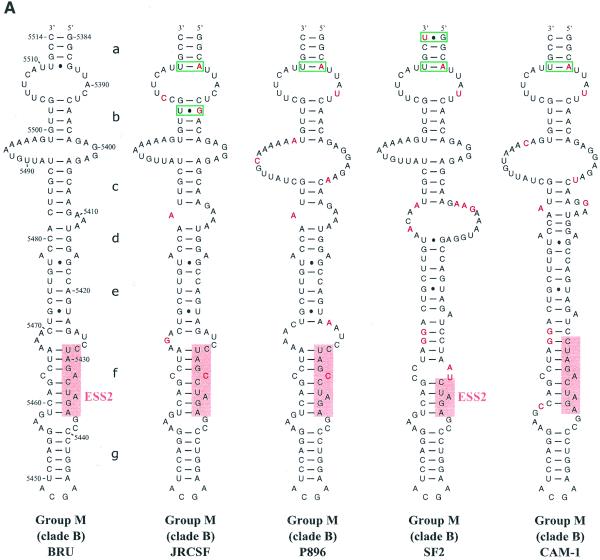
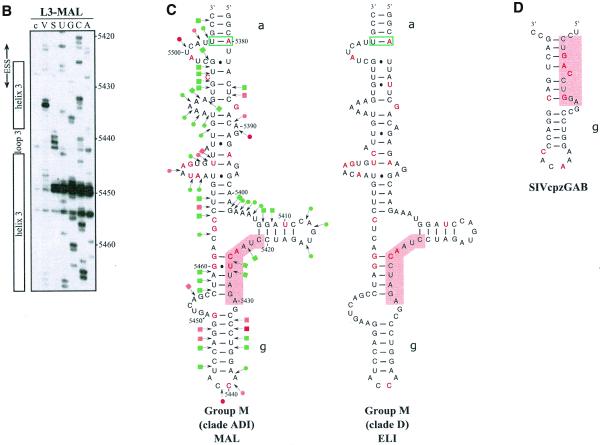
Figure 3.
Comparison of SLS3 in clade B of HIV-1 group M strains and of the corresponding structure in the HIV-1/ELI and MAL strains and in the SIVcpzGAB strain. In this figure, the RNA regions from various HIV-1 strains and the SIVcpzGAB strain, corresponding to the HIV-1/BRU RNA region from positions 5407 to 5484, were identified by sequence alignment using the ClustalW program (43). (A) A secondary structure model based on the one established experimentally for the HIV-1/BRU RNA could be drawn for each strain of clade B that was examined. Base substitutions or insertions as compared to the HIV-1/BRU sequence are shown by red letters. Green rectangles indicate semi-compensatory mutations. The experimentally demonstrated ESS from the HIV-1/BRU and SF2 strains and the putative ESSs of the other strains are shown in a pink rectangle. (B) Experimental study of the HIV-1/MAL RNA structure using primer 831 (same legend as in Fig. 2C). (C) Secondary structure model proposed for the HIV-1/MAL RNA region (positions 5377–5507), on the basis of the experimental data in (B). Cleavages are schematically represented with the same symbols as in Figure 2C. Conserved helices a and g as compared to SLS3 are indicated. The putative ESS is indicated in pink. A similar model can be drawn for the ELI RNA. (D) The terminal part of SLS3 can be formed in the SIVcpzGAB RNA.


