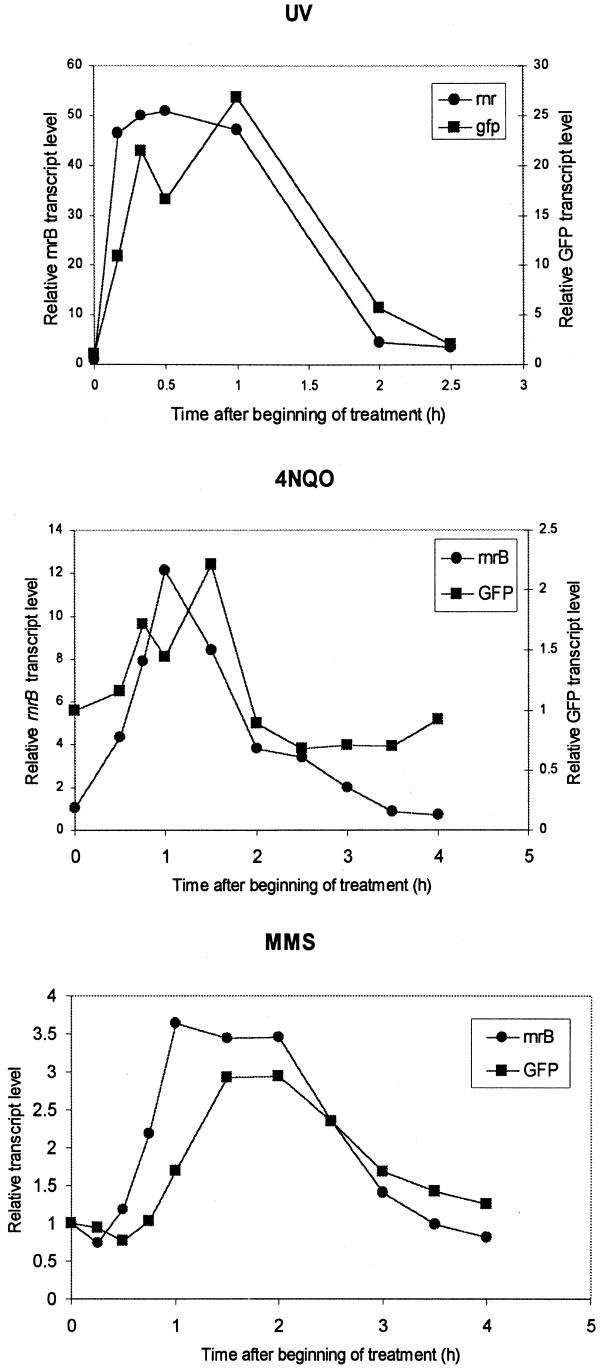
Figure 3.
Kinetics of activation of gene expression controlled by the rnrB promoter. Cells were developed for 4 h before addition of the drugs. Cells were treated with 10 mM MMS, 5 µg/ml 4NQO or 30 J/m2 UV. Samples were collected at the indicated times after treatment and processed for RNA analysis. The 0 time point corresponds to drug addition or irradiation. To correct for loading, blots were probed for expression of the capA gene, whose expression is not affected by the presence of mutagens (7). RNA levels were normalized by dividing the GFP or rnrB transcript levels by that of the capA transcript.

