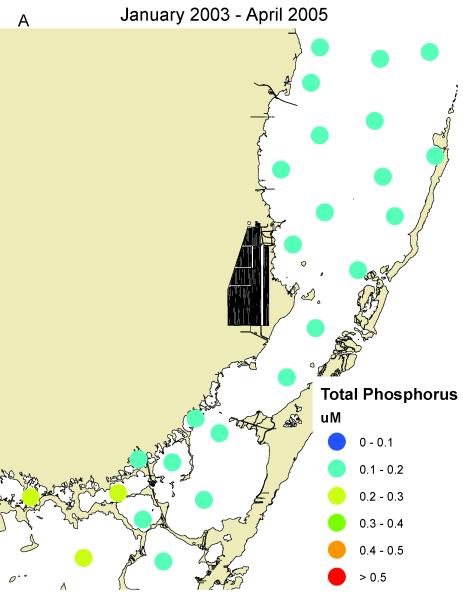
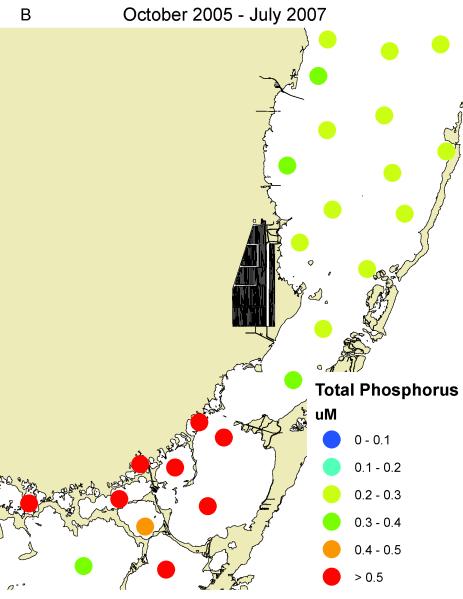
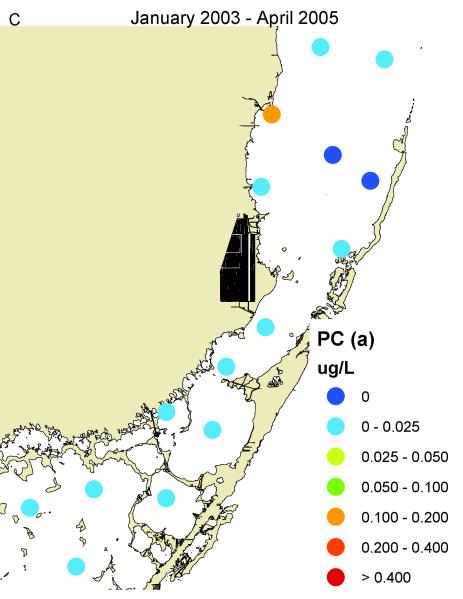
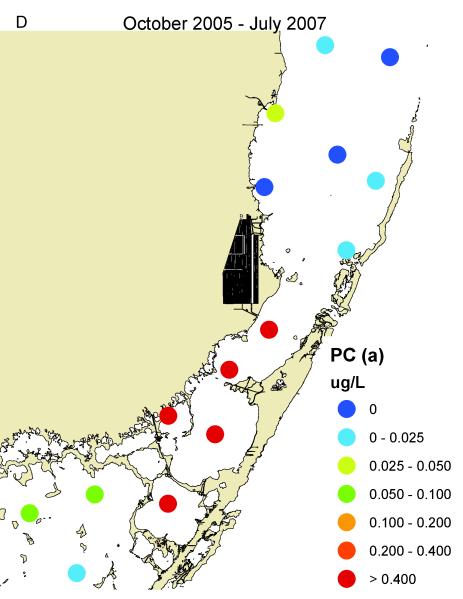
Figure 14.
Concentrations of total phosphorus and cyanobacteria (measured as phycocyanin) in eastern Florida Bay-south Biscayne Bay. A. Total phosphorus before mangrove destruction. B. Total phosphorus after mangrove destruction. C. Cyanobacteria before mangrove destruction. D. Cyanobacteria after mangrove destruction. Total phosphorus concentrations from South Florida Water Management District.


