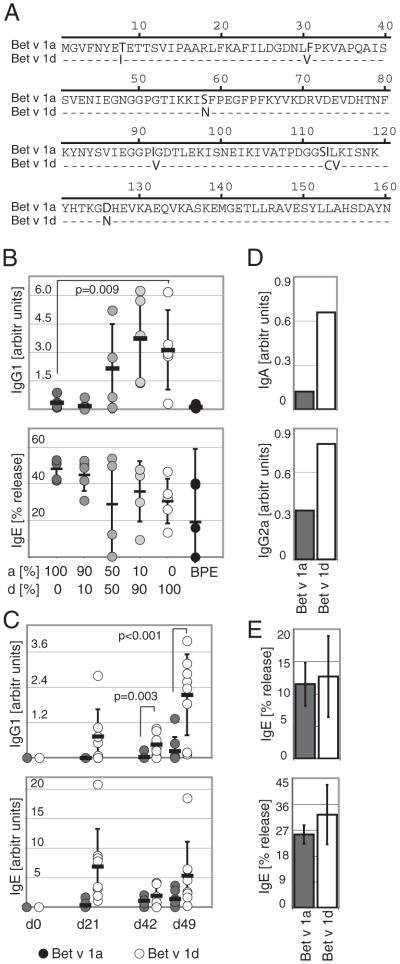
FIGURE 1.
Specific Ab production toward Bet v 1a and d in mice. A, Sequence alignment of Bet v 1a and Bet v 1d. Different residues are indicated in bold. B, Mice were immunized with different mixtures of rBet v 1a and Bet v 1d or with BPE. The composition of each Bet v 1a/d mixture used for immunization is indicated. Specific IgG1 and IgE serum titers were determined by ELISA and β-hexosaminidase release assay at day 49, using an equimolar mixture of Bet v 1a/d as specific Ag. C, Mice were immunized with either Bet v 1a (dark gray circles) or Bet v 1d (○). Specific IgG1 and IgE serum titers were determined on days 0, 21, 42, and 49. (D) Specific IgA and IgG2a titers were determined from pooled sera of day 49 from mice described in C. E, Specific IgE titers from mice described in C were determined by β-hexosaminidase release assay on day 42 (upper panel) and day 49 (lower panel). Titers were determined from individual mice and mean values are shown as bars ± SD. B–D, Each mouse is represented by a circle (n = 5 or 8/group), and pooled sera are shown as bars. Values are shown as arbitrary units in comparison with a pooled standard serum. Mean values are given as dash ± SD; values of p are indicated in graph (unpaired Student t test).

