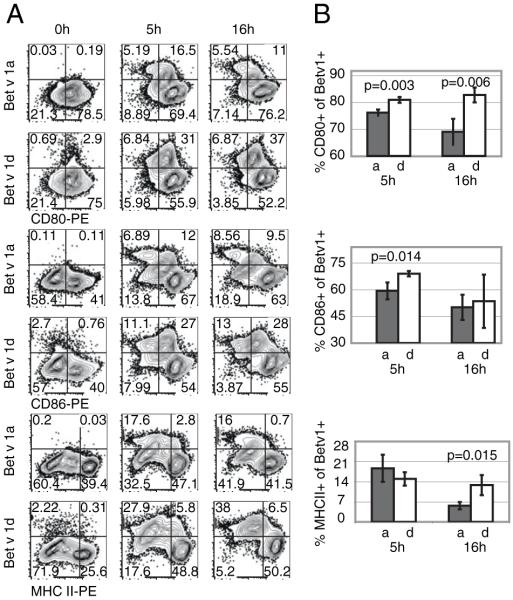
FIGURE 4.
Expression of activation markers by BMDCs upon incubation with Bet v 1a and Bet v 1d. BMDCs were incubated with FITC-conjugated Bet v 1a or d. At different time points (t = 0, 5, and 16 h), cells were stained for CD80, CD86, or MHC II. Cells were gated for CD11c expression, and the amount of CD80, CD86, and MHC II expression was determined. A, A representative FACS profile of CD11c-positive cells. The percentage of cells within each quadrant is indicated. B, Statistical analysis of three independent experiments. Shown are the percentage of CD80 (upper graph)-, CD86 (middle graph)-, and MHC II (lower graph)-expressing cells within the Bet v 1a/d-FITC–positive BMDCs at 5 and 16 h postincubation with specific FITC-conjugated Ag. Mean ± SD; values of p are indicated in graph (unpaired Student t test).

