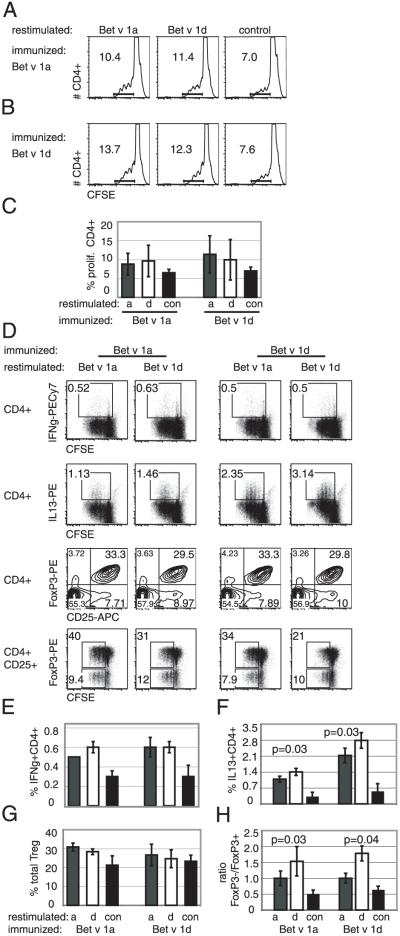
FIGURE 6.
Different proliferation of specific Th1, Th2, and Tregs in coculture experiments with Bet v 1a- or Bet v 1d-pulsed BMDCs. A, BMDCs were incubated with specific Ag (Bet v 1a, left panel; Bet v 1d, middle panel; or no Ag, right panel) and were cocultered with CFSE-labeled syngeneic CD4+ T cells purified from Bet v 1a (A)- or Bet v 1d (B)-immunized mice. Proliferation of Bet v 1-specific T cells was determined after 3 d as decrease of CFSE intensity within the CD4-positive cell population as indicated in each histogram. Representative FACS profiles from four independent experiments are shown (C); statistical analysis of four independent experiments. D, BMDCs were incubated with specific Ag (restim. Bet v 1a or Bet v 1d) and were cocultered with CFSE-labeled syngeneic CD4+ T cells purified from Bet v 1a (left panel)- or Bet v 1d (right panel)-immunized mice (imm. Bet v 1a or Bet v 1d). After 3 d, proliferation of T cells was determined, and differentiation into Th cell subsets was analyzed using staining with specific Abs (Treg: CD4, CD25, FoxP3; Th1: IFN-γ; Th2: IL-13). Representative FACS profiles show the distribution and proliferation of the different Th subsets. E–H, Statistical analysis of experiments from D; H, ratio of proliferating CD4+ CD25+FoxP3− to CD4+CD25+FoxP3+ T cells is shown. Proliferating cells were defined as cells within the rectangular gates of FACS plots from bottom panel in D; n =6. Mean ± SD; values of p indicated in graph (Wilcoxon test).

