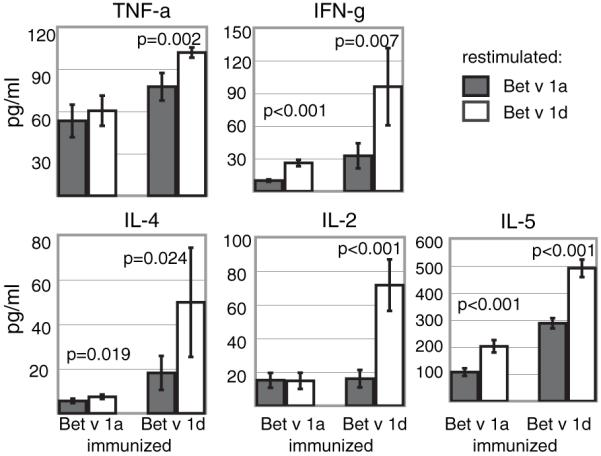
FIGURE 7.

Cytokine production of T cells primed by Bet v 1a- or Bet v 1d-pulsed BMDCs. Cell culture supernatants from coculture experiments described in Fig. 5 were analyzed for the presence of specific cytokines using CBA assays. Shown are absolute amounts of the respective cytokine (mean ± SD; n = 4). (Abbreviations used as in Fig. 5.)
