Figure 4.
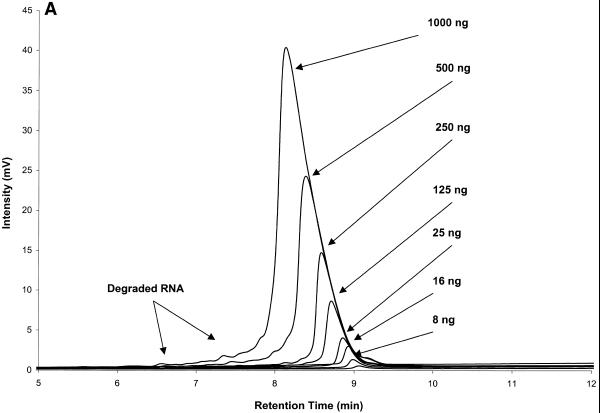
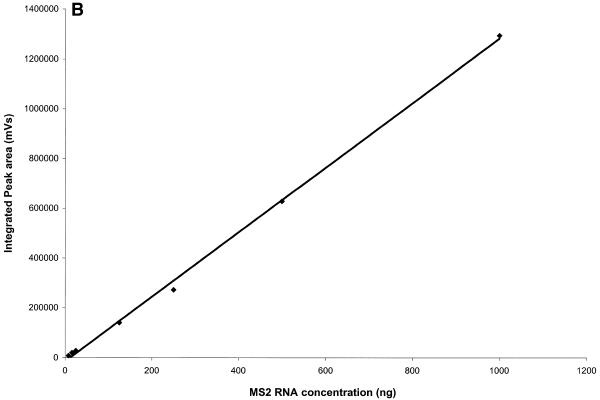
RNA quantification after IP RP HPLC by peak integration. (A) Superimposed chromatograms of known amounts of MS2 RNA analyzed by IP RP HPLC under gradient condition 2. (B) Standard curve for MS2 RNA quantification, plot of integrated peak area from (A) versus injected amount of MS2 RNA (Table 1). The square of the Pearson product moment correlation coefficient (R2) through the given data points is 0.9985.


