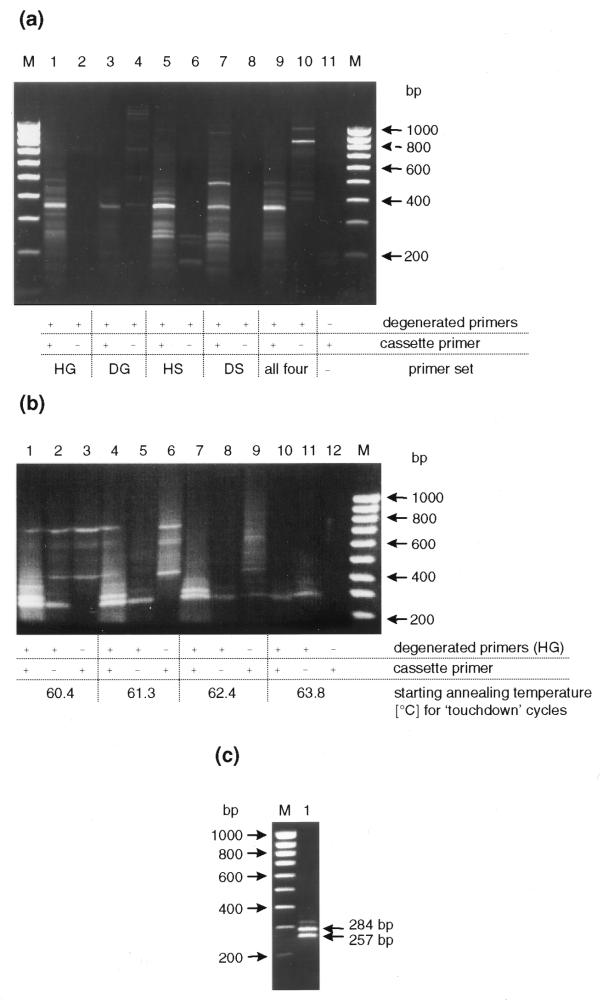
Figure 3.
(a) PCR products generated by amplification with the four different sets of degenerated primers and a mixture of these. The starting annealing temperature of the touchdown PCR was 60°C. (b) PCR products after the first round of amplification with the HG primer set with different annealing temperatures. Primer combinations and starting annealing temperatures of the touchdown cycles are indicated. (c) PCR products after reamplification using enriched products from lane 1 in (b) as template. The bands corresponding to the expected fragments of 257 and 284 bp are marked by arrows.

