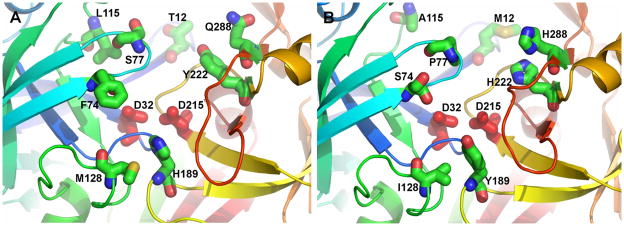
Figure 6. Homology models to predict substrate binding site differences between bovine PAG-2 and PAG-12.
Residues that distinguish the active sites of boPAG-2 (A) and boPAG-12 (B) and pepsin (not shown). The homology models were constructed by using the crystal structure of mature human pepsin bound to pepstatin (PDB code 1PSN) as template by using the SWISS-MODEL server (http://swissmodel.expasy.org//SWISS-MODEL.html) (Guex and Peitsch, 1997; Schwede et al., 2003; Arnold et al., 2006). The backbone ribbon progresses through the colors of the rainbow from blue at the N-terminus to red at the C-terminus. The conserved aspartate side chains critical for peptidase activity are red. Side chains of the active site cleft differing between boPAG-2 and -12 are plotted with standard atom colors of blue for nitrogen, red for oxygen, and green for carbon. The “flap” is light blue.

