
Figure 4. Defective Acentric Segregation in bubR1-KD, bubR1-KEN, and polo1/polo10 Mutants.
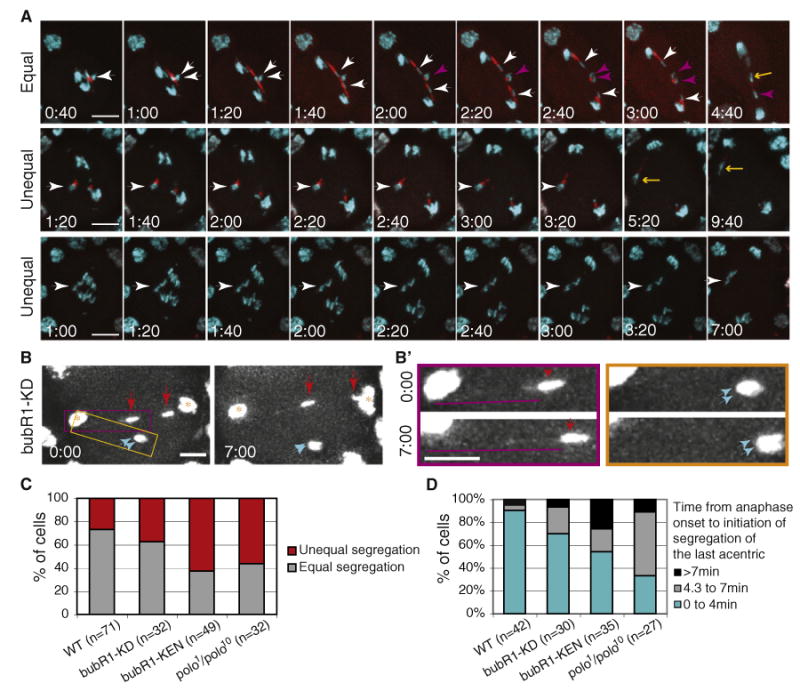
(A) Time-lapse images of anaphase neuroblasts from heat-shocked bubR1-KEN mutant larvae bearing the I-CreI transgene and double labeled with GFP-H2Av (cyan) and RFP-BubR1-KEN (red). The time (min:sec)in the first column represents the time elapsed since anaphase onset. The first row shows an example of equal segregation of acentrics to opposite poles (see Movie S3). Strong RFP-BubR1-KEN signal is present along the length of the tether. The white arrowheads highlight two sister acentrics segregating to opposite poles. The purple arrowheads highlight the other two sister acentrics that will move to opposite poles. The yellow arrow points to the last acentric initiating its poleward movement more than 4 min after anaphase onset. The second and third rows provide examples of defects in acentric segregation. In the second row, two acentrics associated with each other stay at the metaphase plate (white arrowhead) before initiating as low poleward movement toward the same pole (yellow arrow) (see Movie S3). In the third row, the acentrics have not yet initiated poleward movement 7 min after anaphase onset (white arrowhead) (see Movie S3). Each image is a maximum-intensity projection of deconvolved Z series. Time is presented as min:s. The scale bar represents 10 μm.
(B) Early (0:00) and late (7:00) anaphase time points of a bubR1-KD mutant neuroblast after I-CreI induction. GFP-H2Av labels the main mass of segregated chromatids (yellow star) as well as the two pairs of acentrics (red and cyan arrows). One sister acentric rejoined the main chromosomes after 7 min (right red arrow), while the other three sisters remained at the metaphase plate (left red and cyan arrows). The scale bar represents 5 μm.
(B′) The images are enlargements of the yellow and purple highlighted regions in (B). The images surrounded by the purple rectangle show an acentric (red arrows) that remains at the metaphase plate during anaphase. A DNA tether (purple lines) can be detected connecting the acentric to the main mass of chromatids. The tether increases in length over time. The images from the yellow rectangle depict sister acentrics that also linger on the metaphase plate and remain closely associated with one another (cyan arrows). No DNA tether can be detected connecting them to the main mass of segregating chromatids. Images are maximum-intensity projections of deconvolved Z series. Time is presented as min:s. The scale bar represents 5 μm.
(C) Frequency of unequal versus equal segregation of acentrics in wild-type, bubR1-KD, bubR1-KEN, and polo1/polo10 mutant neuroblasts.
(D) Frequency of neuroblasts in which the last acentric initiates its poleward movement within 4 min, from 4.3 to 7 min or after 7 min following the onset of anaphase in the wild-type and bubR1-KD, bubR1-KEN, and polo1/polo10 mutants. The last category (>7 min) includes neuroblasts where acentrics never initiate poleward movement within the time frame of the movie. n = number of neuroblasts.
See also Figure S2.