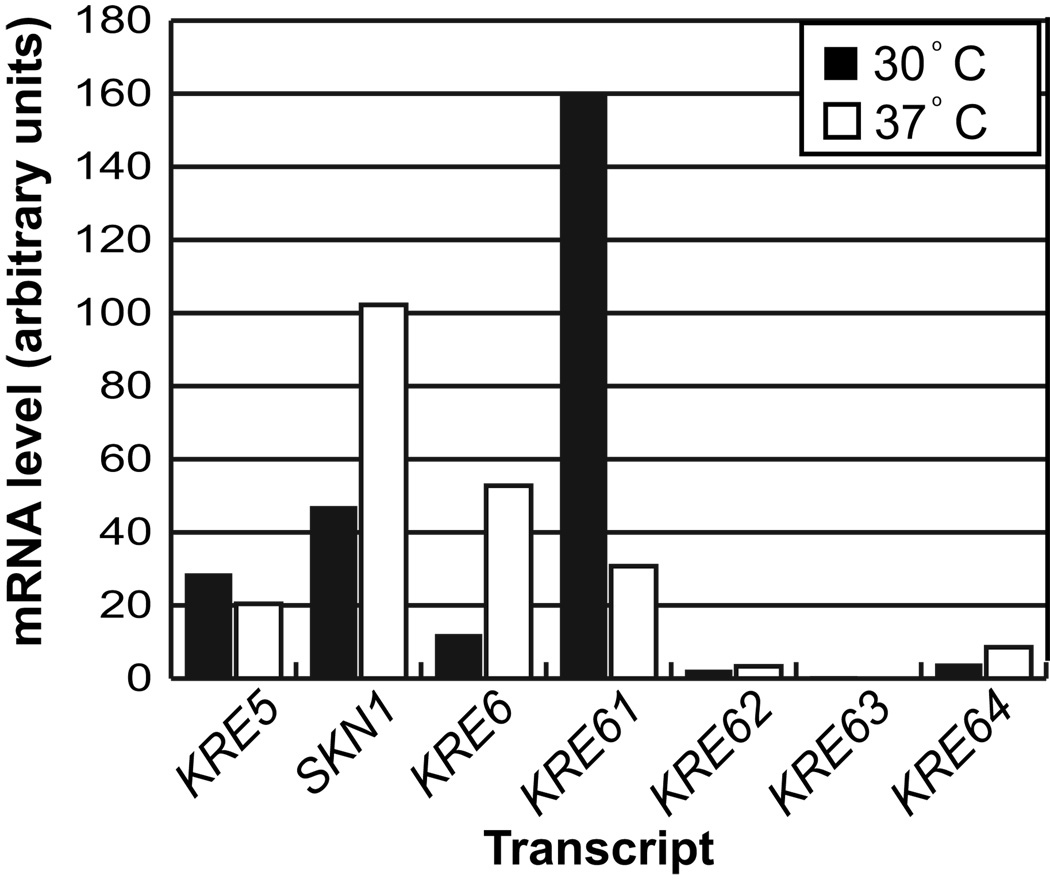
Fig. 3.
Northern blot mRNA expression analysis of KRE5 and the KRE6/SKN1 homologs in C. neoformans. H99 was grown in liquid culture for 24 h at the indicated temperatures. Relative gene expression was determined utilizing ImageQuant (version 5.1) and was normalized to the level of actin. Values are the average of two independent biological replicates.

