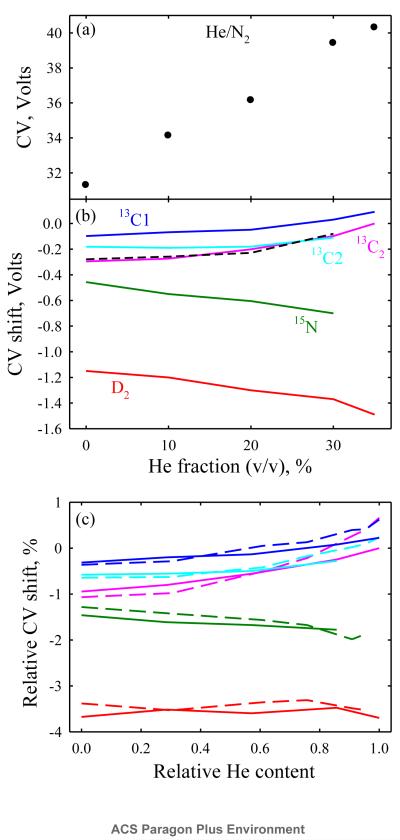
Fig. 4.
Panels (a, b) replicate Fig. 2 (a, b) at DV = 5.4 kV, (c) shows the CV shifts as a percentage of CV for normal glycine at DV = 5.4 kV (solid lines) and 4 kV (dashed lines). The horizontal axis in (c) is in terms of the fraction of maximum He content at each DV (assumed 66% for 4 kV and 35% for 5.4 kV).

