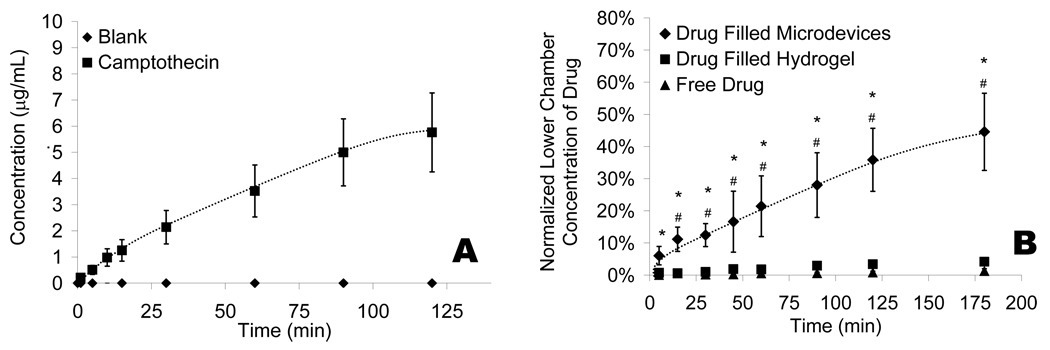
Figure 3.
A) The release of auto-fluorescent chemotherapeutic camptothecin was measured in PBS with a fluorescent spectrometer and reported as concentration in microgram per milliliter. The blank hydrogel represents the amount of camptothecin release for a non-drug loaded hydrogel in a microdevice. B) The permeation of camptothecin through a caco-2 epithelial monolayer on collagen treated Transwells®. The concentration in the bottom well of the Transwell® was normalized to that of the top well. An * indicates statistical significance with respect to the free drug conditions. A # represents significance with respect to drug filled hydrogels. All data is presented as average ± standard deviation.

