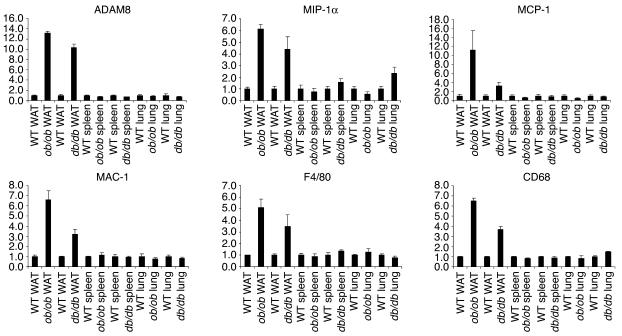
Figure 3.
The transcriptional regulation of ADAM8, MIP-1α, MCP-1, MAC-1, F4/80, and CD68 in macrophage-rich tissues (WAT, lung, and spleen) of ob/ob and db/db mice. For comparison, the gene expression level in lean mice was arbitrarily set at 1; error bars represent ± SE. y axes show arbitrary units representing relative expression levels of mRNAs.

