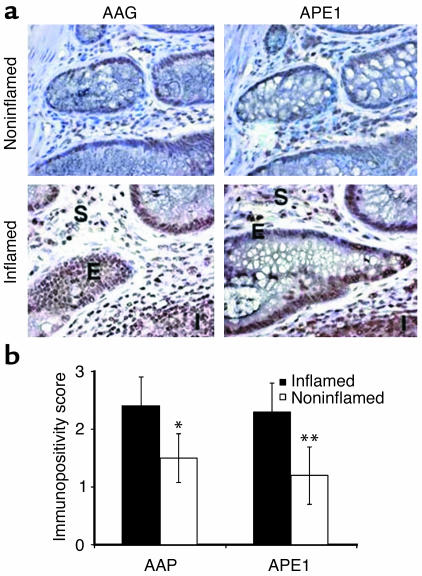
Figure 1.
Cellular localization and quantification of AAG and APE1 in the UC colon. (a) AAG and APE1 were present in inflammatory cells (I) and in the mucosa (epithelium [E] and stroma [S]) of a patient with UC. Magnification, ×400. (b) AAG (n = 8) and APE1 (n = 8) levels were quantified in areas of UC colon pathologically defined as inflamed (black bars) and noninflamed (white bars). *, significantly lower AAG levels in the noninflamed areas of the UC colon (P = 0.04). **, significantly lower APE1 levels in the noninflamed areas of the UC colon (P = 0.003). Scoring criteria are described in Methods.

