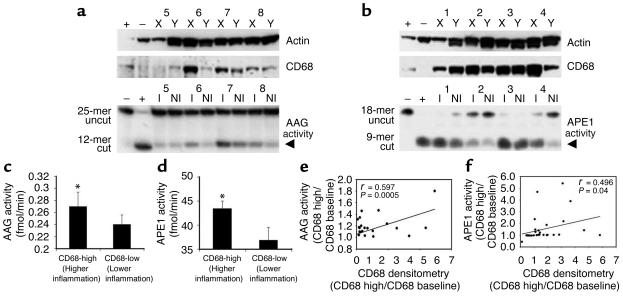
Figure 2.
AAG and APE1 activities adaptively increase in response to increasing amounts of inflammation. (a) Examples of how levels of CD68 parallel changes in AAG activity. Tissues X and Y were categorized into inflamed (I) and noninflamed (NI) areas as described in Methods, then assessed for AAG activity (arrowhead). (b) Examples of how levels of CD68 parallel changes in APE1 activity. Tissues X and Y were categorized into inflamed and noninflamed areas as described in Methods, then assessed for APE1 activity (arrowhead). (c) Comparison of activity of AAG in areas of the UC colon categorized by CD68 levels as noninflamed or inflamed (n = 30). *, significant difference from CD68-low tissues (paired t test, P < 0.01). (d) Comparison of activity of APE1 in areas of the UC colon categorized by CD68 levels as noninflamed or inflamed. *, significant difference from CD68-low tissues (paired t-test, P < 0.01). (e) Pearson correlation coefficient quantifying the ratio of samples X/Y with regards to CD68 densitometry and AAG activity. (f) Pearson correlation coefficient quantifying the ratio of samples X/Y with regards to CD68 densitometry and APE1 activity.

