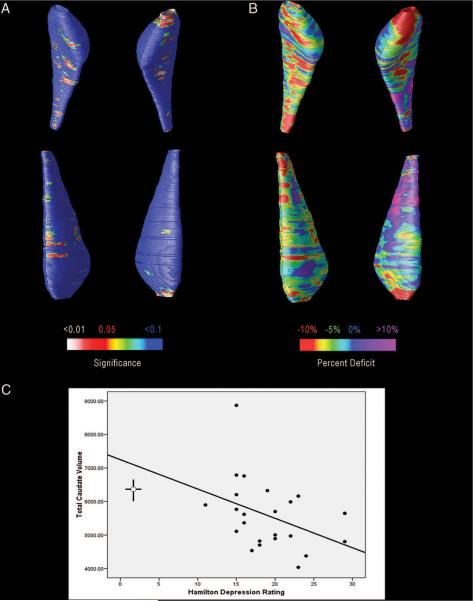
FIGURE 1. Maps of Caudate Reduction in Depressed Subjects, Adjusted for Age.
Notes: The caudate is oriented so that it faces the reader and right and left are reversed. To better localize atrophic changes that might account for the overall 13% mean reduction in caudate volume, average surface maps were compared between the depressed and control groups. [A] Shows regions in red colors, that show evidence of reduction in radial size in the depressed group versus controls. The significance maps are assessing, at each point on the caudate surface, the t statistic for the group difference between patients and controls, for the radial distance between that point and a medial axis threading down the center of the caudate in each subject. As such, the t statistic has 37 df, i.e., one less than the total number of subjects in the study. The same distribution, with the same number of degrees of freedom, is used for the assessments of volume reduction. [B] Shows that the level of reduction reaches 10% in the most anterior caudate regions. [C] Shows a scatterplot, revealing the significant correlation between depression severity and caudate volumes, with the best fit line. The crossed lines on the left-hand side indicate the mean and 95% CI for both the Hamilton Depression Rating Scale-17 and caudate volumes of the comparison subjects (HDRS-17 mean: 1.80; CI: 0.90–1.8, Caudate mean: 6419, CI: 6746–6096).

