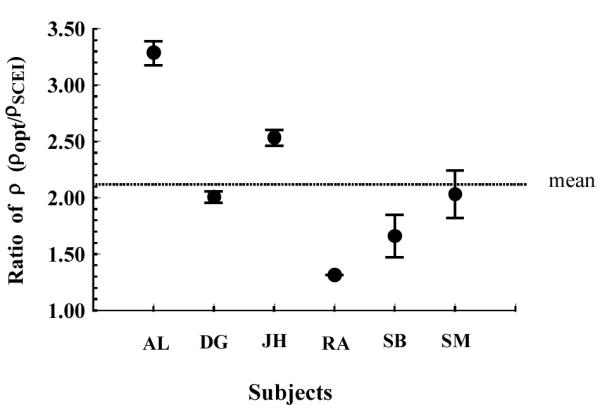
Figure 6.

Ratio of the optical and psychophysical estimates of rho for each subject at the fovea. Each solid circle indicates the mean of the ratio for each individual, and the error bar represents ∀1 std error of the mean. The vertical dotted line shows the average across subjects.
