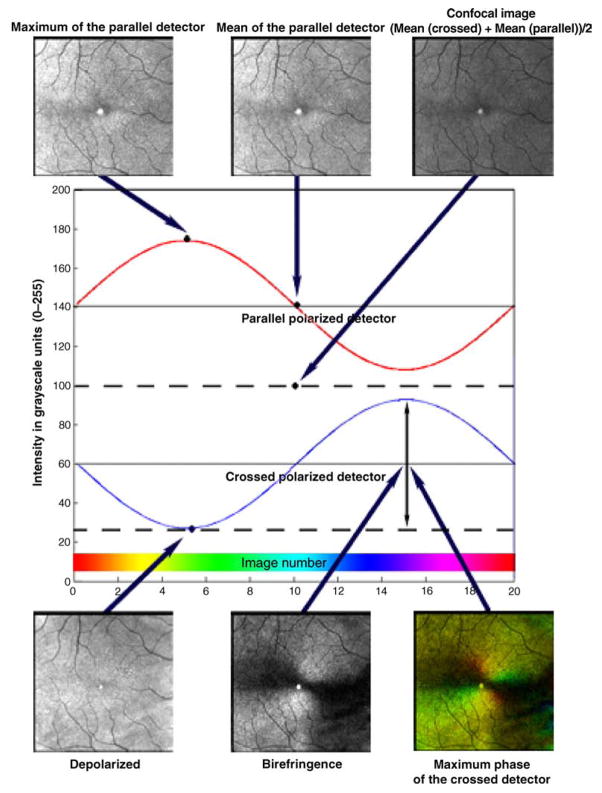
Figure 1.
Calculations used to derive the 6 image types used for foveal location grading based on a single data set. The GDx has 2 detectors and information is combined from each of the detectors or a combination of the 2 detectors. The intensity at each pixel location is fit to a sine wave (red line and blue line) using a Fast Fourier Transform, which acts as a low-pass filter for the data, prior to image calculations. The Maximum of the Parallel Detector Image (top left) shows the highest amplitude of modulation, regardless of input polarization angle, thereby emphasizing contrast in the image relative to the most specularly reflected or polarization retaining structures. The Mean of the Parallel Detector Image (top center) is the average amount of light returning to the parallel detector. The Confocal Image (top right) is the average of the amount of light returning to both detectors. The Confocal Image is a polarization insensitive image. The Depolarized Light Image (bottom left) is the minimum value of the modulation for light returning to the crossed detector, which removes any variation due to polarization across the 20 images. The Birefringence Image (bottom center) is the amplitude of the modulation across polarization input angles of the light returning to the crossed detector. The Maximum Phase of the Crossed Detector Image (bottom right) indicates both the amount of birefringence and is coded with the Cardinal Directions Color map as in Elsner et al. (2007). There is a bright reflection artifact inherent in this GDx that is at the center of each image.

