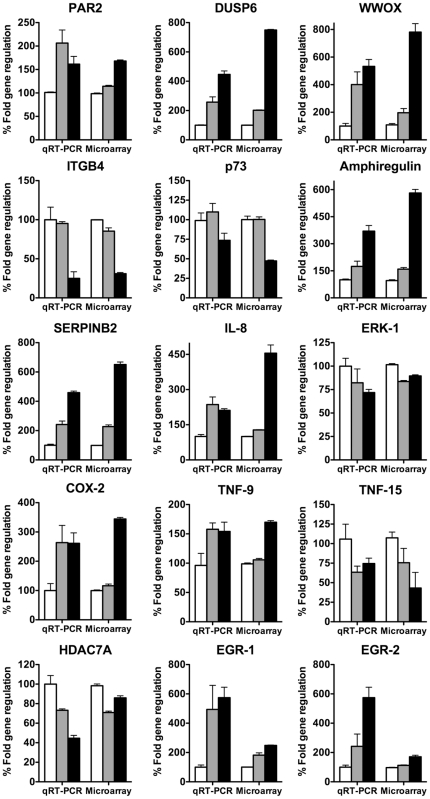
Figure 3. Correlation between microarray gene expression and qRT-PCR.
HEK293 cells were treated with trypsin or 2f-LIGRLO-NH2 and total RNA was extracted 6 h later. Data represent the average of 3 independent experiments. Columns (negative control, white; 2f-LIGRLO-NH2, grey; trypsin, black) show representative regulation of PAR2, DUSP6, WWOX, ITGB4, p73, Amphiregulin, SERPINB2, Il-8 precursor, ERK-1, COX-2, TNF-9, TNF-15, HDAC-7A, EGR-1 and EGR-2 by PAR2 activation. Results from qRT-PCR were compared to microarray data at equal times.

