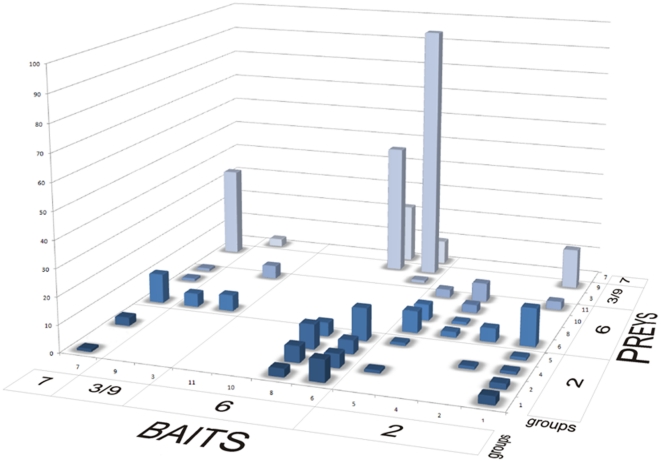
Figure 2. Three dimensional column diagram of the number of clones of septin prey proteins fished by septin bait proteins in group wise organization.
Number of fished clones for each prey septin (Y-axis), was plotted against bait (X-axis) and prey septins (Z-axis), where the septins have been ordered in a group wise fashion (See Table S1 for raw data of clone numbers). The whole distribution is significantly (p = 0.0004998) different from a random distribution, as can also be verified visually, since the clone numbers group into “islands” in between various blank areas. When we compared groups in a one-to-one and reciprocal fashion we obtained significant p-values (p<0.001), suggesting a non-random distribution, for the following pairs of groups: group 2 vs. group 6, group 6 vs. group 3/9, group 6 vs. group 7, and group 3/9 vs. group 7. Furthermore, we can still analyze the occurrence of interactions among septins of the same group. The result in this case is obvious: members of groups 6, 3/9 and 7 never interacted with themselves or with other members of the same group. The only exception is group 2, which members tended to interact with other group 2 members. See also Fig. 3.

