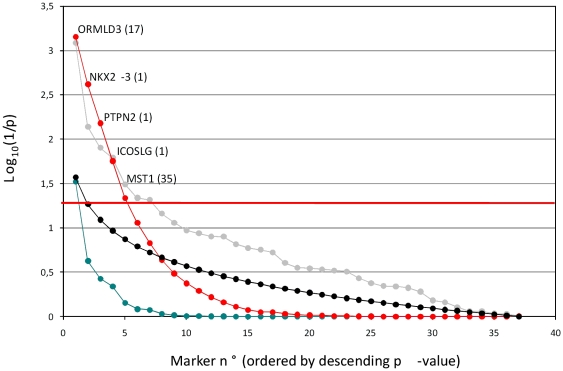
Figure 1. Association of 36 SNPs known to influence CD risk with AS.
SNPs are ordered on the X-axis by increasing p-value. Y-axis: log10(1/p), corresponding to (i) nominal p-values (gray), (ii) Bonferroni corrected p-values (blue), (iii) expected distribution of p-values assuming that all SNPs are true null hypotheses (black), and (iv) the p-value of the distribution of individual p-values for the corresponding marker plus all the less significant ones (red). The horizontal line corresponds to a p-value of 0.05. The names of gene of interest in the vicinity of the associated SNPs as well as the number of genes in the confidence interval (defined according to [7]) are given for the five most interesting SNPs, exceeding the 0.05 significance threshold using the approach that extracts information from the p-value distribution.

