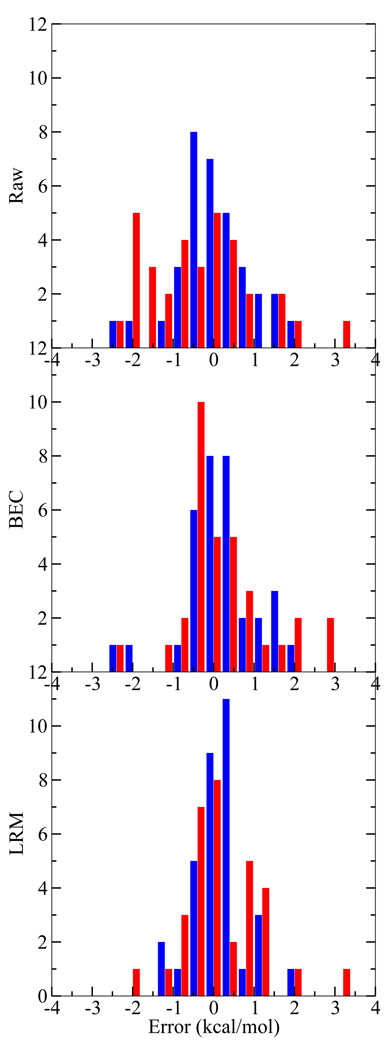
FIG. 2.
Proton affinity error histogram for the CBS (blue, left bar) and QCRNA (red, right bar) against experiment (top), with bond energy correction (middle), and linear regression model (bottom). See text for bond energy correction (BEC) and linear regression model (LRM) information. Histogram bins are width 0.5 kcal/mol.

