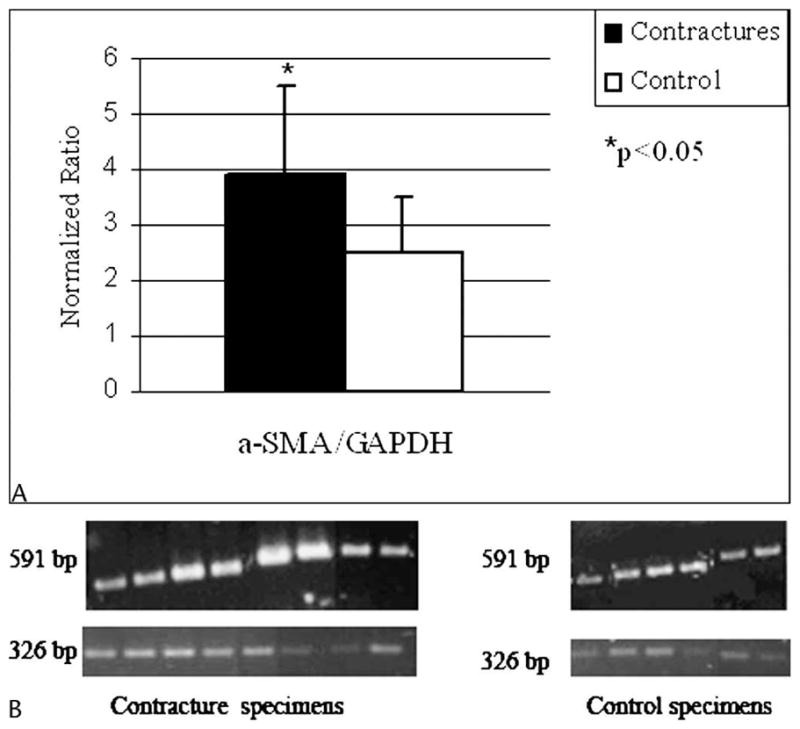
Fig 1.

A–B. (A) A graph shows the optical density measures for the contracture (n = 8) and control (n = 6) specimens. (B) A representative RT-PCR analysis shows α-SMA mRNA expression and the housekeeping gene, GAPDH. The α-SMA appears at 591 bp and GAPDH appears at 326 bp. There are eight contracture specimens and six control specimens.
