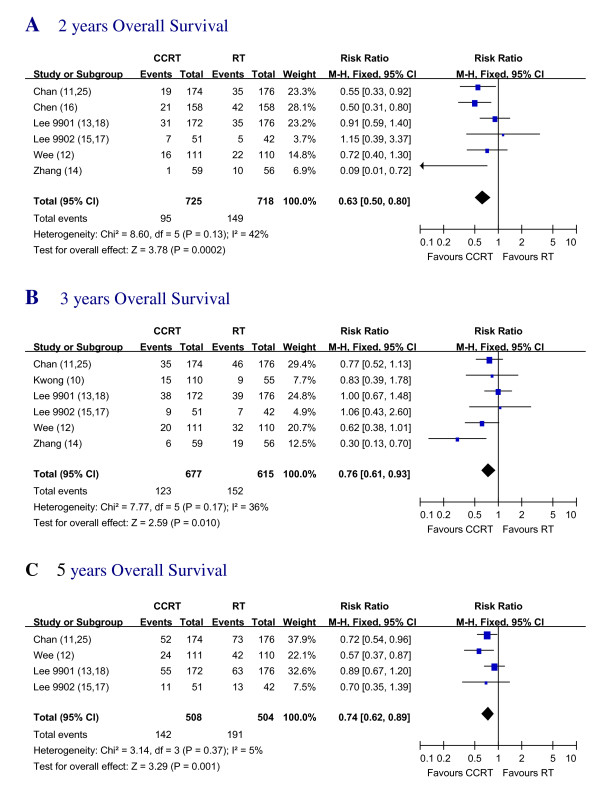
Figure 2.
Two, Three and Five years Overall Survival of CCRT vs. RT. Forest plot of the risk ratio (RR) of the 2 years, 3 years and 5 years OS with radiotherapy (RT) alone versus radiotherapy plus concurrent chemotherapy (CCRT). The estimate of the RR of each individual trial corresponds to the middle of squares and the horizontal line gives 95% CI. The closed diamond shows the overall RR with its 95%CI. RR less than 1 indicated improved survival for the CCRT compared with RT alone.

