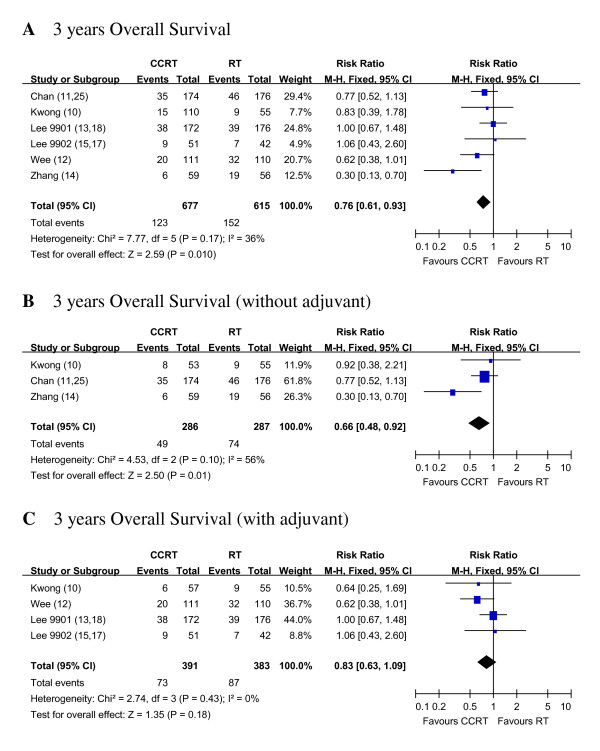
Figure 3.
Three years Overall Survival of RT alone vs. CCRT with and/or without AC. Forest plots of the risk ratio (RR) of the 3 years OS with RT alone vs. pure CCRT and 3 years OS with RT alone vs. CCRT + AC. The estimate of the RR of each individual trial corresponds to the middle of squares and the horizontal line gives 95% CI. The closed diamond shows the overall RR with its 95%CI. RR less than 1 indicated improved survival for pure CCRT with or without AC compared with RT alone. Kwong_AB: In Kwong's trial, for subgroup analysis with pure CCRT vs. RT, group A and B were compared. Kwong_AD: In Kwong's trial, for subgroup analysis with adjuvant groups, A and D were compared.

