Figure 1.

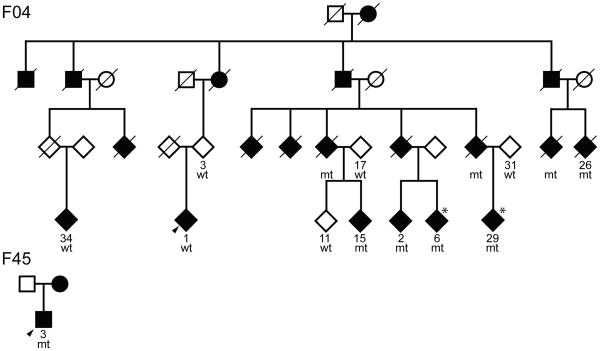
A) Pedigrees of F04 and F45
Pedigrees of F04 and F45. Individuals with DNA available are numbered beneath symbols, the proband in each family is arrowed, males are squares, circles are females, diamonds are gender disguised. A diagonal line indicates the subject is deceased, mt = carrier, wt = non-carrier. Asterisks refer to subjects with asymmetric SPECT images.
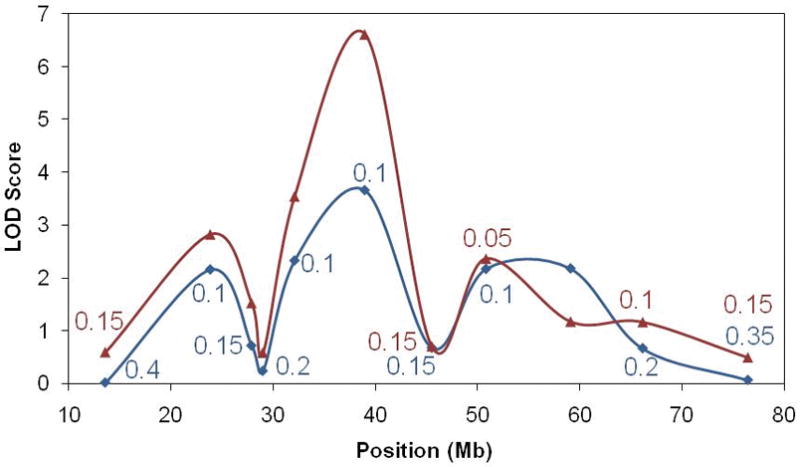
B) LOD scores
Model-based, maximum two-point LOD scores are illustrated across chromosome 12. The red line shows values obtained assuming F04-1 and F04-34 are disease phenocopies, whereas the blue line was calculated assuming they have the same cause of disease. The value of θ is only given for each marker when different from 0.0. The genomic location of LRRK2 is under the peak at 39Mb.
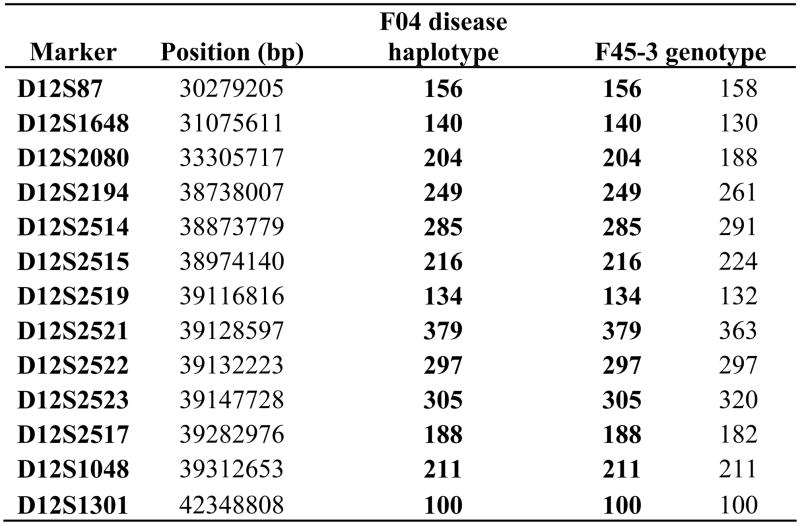
C) Disease-segregating chromosome 12q12 haplotype
The higher-resolution phase-known haplotype and genotypes of F04 and F45-3 are shown.


