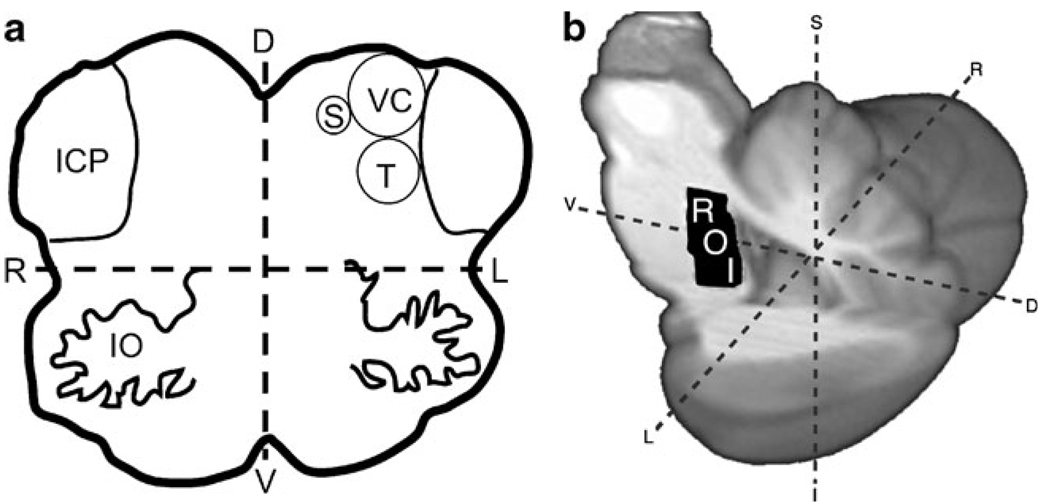
Fig. 1.
Brainstem anatomy and ROI location. a Axial diagram of the brainstem at the pontomedullary junction shows the proximity of the Vestibular nuclei complex (VC) to the Trigeminal (T) and Solitary (S) nuclei, the apparent brainstem targets of CN-NINM. b A region of interest (ROI) was drawn on a high-resolution atlas of the brainstem and cerebellum (right) to analyze the BOLD signal changes in the area of overlap between the vestibular, trigeminal, and solitary nuclei bilaterally. IO Inferior Olive; ICP Inferior Cerebellar Peduncle; L/R Left/Right; I/S Inferior/Superior; V/D Ventral/Dorsal)

