
Figure 4. 250 μM H2O2 pretreatment decreases JC-1 loading.
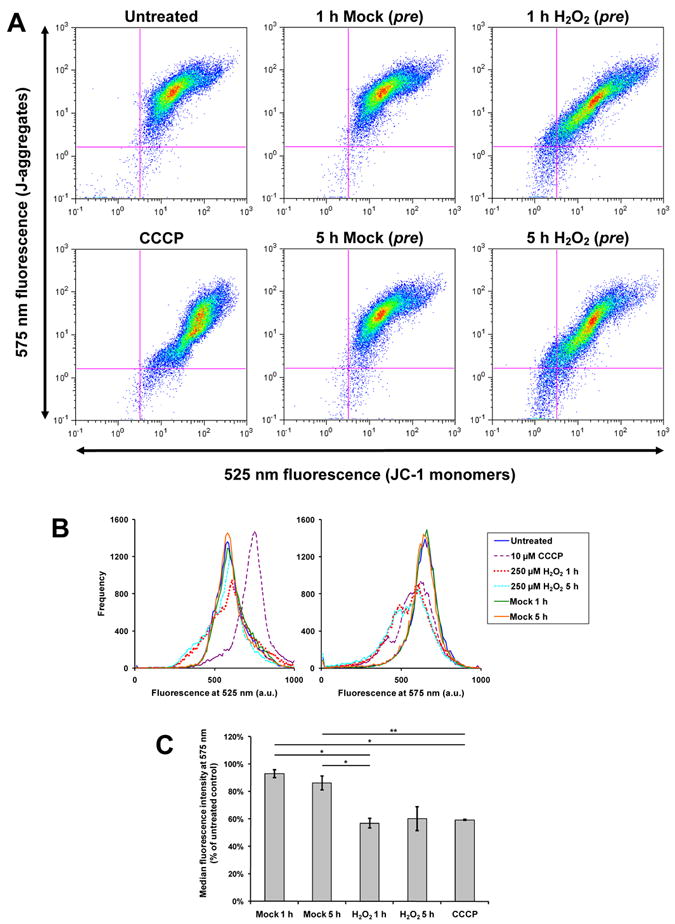
C2C12 cells were pretreated with 250 μM H2O2 or 0 μM H2O2 (“mock”) for 1 or 5 hours, or were not pretreated (“untreated”). Subsequently, cells were stained in 2 μM JC-1 for 30 minutes, trypsinized, and analyzed by flow cytometry. Some “untreated” cells were treated with 10 μM CCCP before flow cytometry (denoted “CCCP”). A, two-parameter (log scale) pseudo-colored dot plots for fluorescence detected at 525 nm and 575 nm. B, the data from A shown as superimposed single-channel histograms. Notably, H2O2 pretreatment (whether for 1 hour or 5 hours) causes a marked shift toward lower 575 nm fluorescence. In A and B, data from 1 representative experiment of 3 are shown. C, quantification of JC-1 fluorescence at 575 nm (J-aggregates). The median fluorescence intensity of each single-channel histogram was expressed as a percentage of the “untreated” control of that experiment. Mean percentages ± SEM of 3 independent experiments are shown. *P < 0.01; **P < 0.05. One- and five-hour pretreatments with 250 μM H2O2 appear to have similar effects in decreasing median 575 nm fluorescence intensity.