Figure 1.

Prolonged repolarization induces TWL
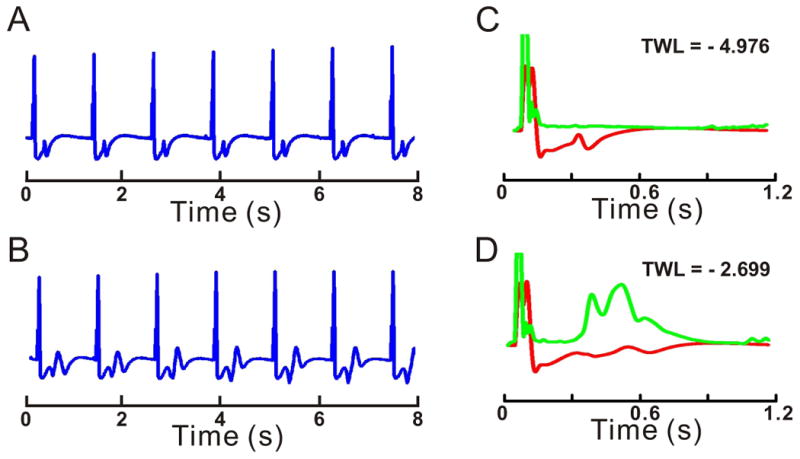
Examples of EKG recordings during pacing at 50 beats per min: (A) Control and (B) LQT2. T-wave morphology is constant in A, but changes on a beat-to-beat basis in B. EKG lability (green traces) is plotted before (C) and during LQT2 (D) and is superimposed on signal-averaged EKG (red traces). The Y-axis for lability is expanded 10-fold with respect to signal-averaged EKG. TWL is calculated as the logarithm of maximum EKG lability measured during the repolarization phase and normalized with respect to the amplitude of signal-averaged QRS. TWL is essentially absent in C and highly pronounced in D. Maximum lability occurs at ∼470 ms after the pacing stimulus in this case.
