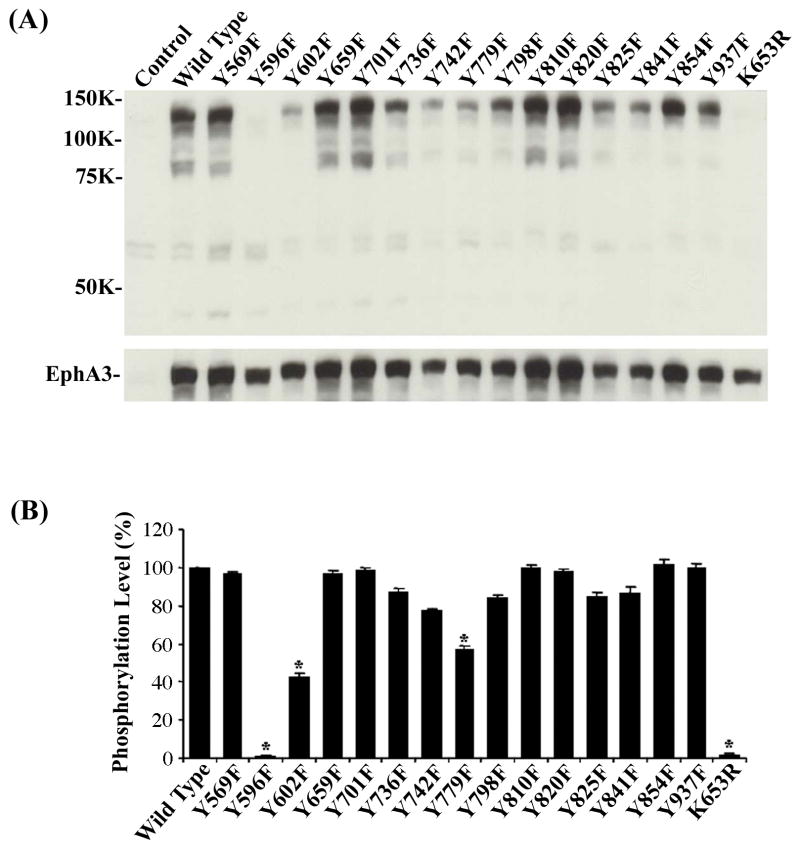
Figure 1. Effects of tyrosine mutations on EphA3 autophosphorylation.
(A) Reduction of EphA3 autophosphorylation in several tyrosine mutants. EphA3 mutants were transfected into HEK 293A cells and treated with clustered ephrin-A5 for 15 min two days later. Cell lysates were analyzed by Western blot analysis. Top panel: Western blot analysis with anti-phosphotyrosine antibody; Bottom panel: the same membrane was re-probed with an anti-EphA3 antibody to assess protein levels. (B) Quantification of the relative intensities of receptor autophosphorylation with optical intensity scanning. Data were normalized to cells harboring wild type EphA3. Bars represent the means of three independent experiments; error bars indicate standard deviation. Asterisk * indicates α < 0.05 vs wild type (one-way ANOVA followed with Bonferroni test for selected pairs).

