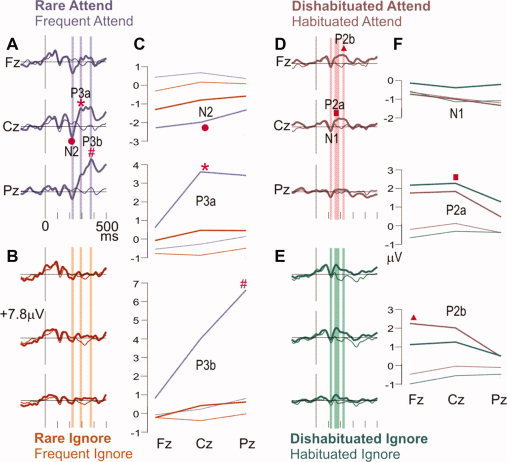
Figure 2.

Grand average ERP waveforms at midline scalp sites. Event‐related potentials, as recorded at the frontal (Fz), central (Cz), and parietal (Pz) scalp midline. The attended rare shifts in the tone sequence (A) evoked an N2 (•), P3a (*), and P3b (#). The P3a and P3b are greatly decreased when the tones are ignored (B), whereas the N2 is relatively little changed. The vertical bars show the latency ranges when the average amplitudes corresponding to the N2, P3a, and P3b were measured (A, B). These amplitudes are plotted in C, where the N2 (•) to rare shifts (thick lines) is more negative than to frequent tones (thin lines), and is little changed whether the stimuli are attended (purple) or ignored (orange). In contrast, both rarity and attention are required for the P3a (*, thick purple) and P3b (#, thick purple). At right, waveforms evoked by frequent tones with different states of habituation are compared (D, E, F). The vertical bars show latency ranges for estimating the N1, P2a, and P2b (D, E). At early latency (N1 period), the frequent tones evoked a small negativity in all conditions. A positive wave at about the same latency as the N2 is larger when the tone's pitch is different from that of the immediately preceding tone (thick vs. thin lines, marked with ▪, ▴). Similar waveforms are evoked by attended (D) versus ignored (E) frequent tones, and average amplitude measurements confirm this (green vs. brown lines, panel F).
