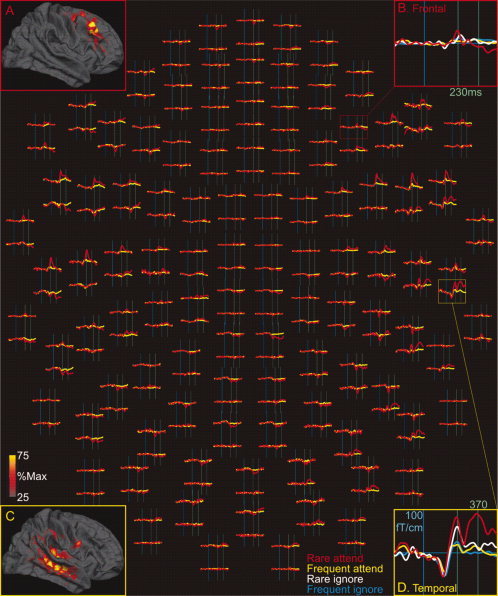
Figure 3.

Gradiometer waveforms in a typical subject. Average responses to attended rare and frequent stimuli at all 204 gradiometers are shown in the center of the figure. Activity at single sensors over the frontal lobe (red box) and over the temporal lobe (yellow box) are expanded for clearer view (B, D). The lead fields for these sensors (A, C) were calculated as the contribution of each cortical dipole to the signal recorded at the sensor, relative to the contribution of the dipole that contributes the most. Shown here are the lead fields averaged across subjects; the individual subject lead fields are shown in Figure 10. The sensor over the frontal lobe (#1233) records almost exclusively from dorsolateral prefrontal cortex (A), whereas the sensor over the temporal lobe (#2612) records mainly from temporal cortex with a small contribution from supramarginal and ventral precentral cortices (C). Note that both frontal and temporal sensors record large responses to attended rare stimuli, but with different time courses.
