
Figure 9.
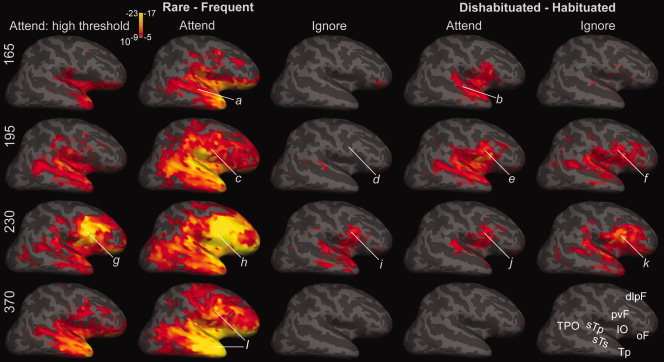
Effects of rarity and dishabituation for attended and ignored conditions. Lateral views of the right hemisphere at four latencies show differential activity evoked by rare as compared with frequent tones (left three columns), and by dishabituated as compared with habituated frequent tones (right two columns). At 165 ms attended rare (a) and attended dishabituated (b) tones both evoke differential activity in frontotemporal sites, with the response to rarity most significant in Tp, IO, and oF, and that to dishabituation in sTp, sTs, IO, and pvF. These responses increase at 195 ms (c,e), at which time the ignored dishabituated tones evoke differential activity in frontotemporal sites (f), whereas ignored rare tones do not (d) until ∼230 ms (i). At this time, differential activity in pvF, IO, and sTp is evoked by attended and ignored, rare, and habituated tones (g,h,i,j,k). Note that at both 195 and 230 ms, more differential activity is evoked by ignored dishabituated tones (f,k) than by ignored rare tones (d,i). However, at longer latencies, differential activity was only evoked by attended rare tones (l). As more differential activity was evoked by rare attended tones than the other conditions, it is plotted with two significance scales. Significance scales in the left column are as in Figure 4, but are lower in the other columns, with a threshold of P < 10−5, full red indicating P < 10−8, and full yellow P < 10−17. The high threshold at left allows the anatomical distribution of activity to be better appreciated, whereas the consistent threshold at right allows activity levels to be compared across conditions. Abbreviations for the cortical areas in the lower right brain are as in Figure 4. Cross‐subject averages from gradiometer data.