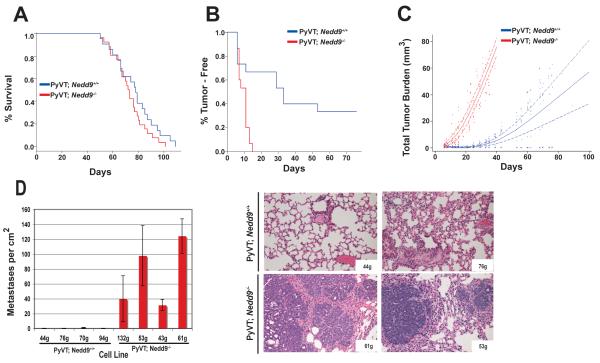
Figure 1. Comparison of in vivo growth of MMTV-PyVT;Nedd9+/+ versus MMTV-PyVT;Nedd9−/− primary tumors and derivative cell lines.
A. Kaplan-Meier curve showing insignificant increase in time from appearance of tumors to maximal growth before euthanasia in MMTV-PyVT;Nedd9−/− (n=26) versus MMTV-PyVT;Nedd9+/+ (n=21) mice (p=0.181). B. Independent cell lines derived from MMTV-PyVT;Nedd9−/− and MMTV-PyVT;Nedd9+/+ primary mammary tumors (3 per genotype) were injected orthotopically into the mammary pads of SCID mice (n=5/cell line; 30 mice total). Data shown represent significant difference in time till appearance of tumors (p=0.001). C. Significant decrease in total tumor burden in SCID mice with tumors derived from MMTV-PyVT;Nedd9+/+ versus MMTV-PyVT;Nedd9−/− cell lines (p=<0.001). D. MMTV-PyVT;Nedd9−/− cell lines more effectively form lung metastases following tail vein injection. Left, quantification of lung metastases/cm2, averaged from 5 mice for each of 8 cell line, 21 days after tail vein injection. Difference between genotypic groups is highly significant, P<0.0001. Right, hematoxylin and eosin stained lungs derived from SCID mice 3 weeks after tail vein injection of representative MMTV-PyVT;Nedd9−/− and MMTV-PyVT;Nedd9+/+ cell lines, taken at magnification 10x.

