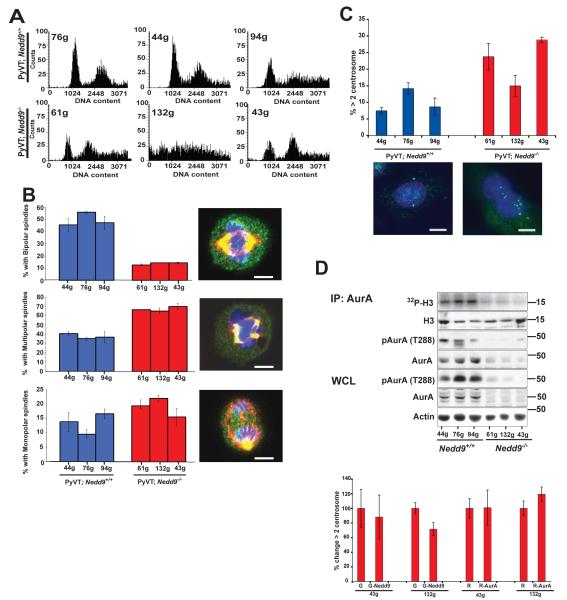
Figure 3. Cell cycle abnormalities in MMTV-PyVT;Nedd9+/+ versus MMTV-PyVT;Nedd9−/− cell lines.
A. FACS analysis of asynchronously growing MMTV-PyVT;Nedd9−/− versus MMTV-PyVT;Nedd9+/+ cell lines indicates more cells with 4N or greater DNA content. B. Mitotic profiles in asynchronously growing cells demonstrate fewer normal bipolar spindles (p=<0.001) and more multipolar (p=0.001) and monopolar (p=0.002) spindles in MMTV-PyVT;Nedd9−/− versus MMTV-PyVT;Nedd9+/+ cell lines. >50 mitoses were counted/cell line in each of 3 independent experiments. Representative cells are visualized with DAPI (blue), α-tubulin (red) and γ-tubulin (green). Scale bar, 5 μn. C. Increased frequency of supernumerary centrosomes in MMTV-PyVT;Nedd9−/− versus MMTV-PyVT;Nedd9+/+ cell lines (p=<0.001). >100 cells were counted/cell line in each of 3 independent experiments. Images indicate representative cell with normal centrosome count (left) and supernumerary centrosomes (right), visualized with DAPI (blue) and γ-tubulin (green). Scale bar, 10 μm. D, IP:AurA, immunoprecipitation (IP) of total AurA from cell lines followed by in vitro kinase assay with phosphorylated histone H3 as substrate visualized by 32P-ATP, and with immunoprecipitated, autophosphorylated (T288) AurA, total AurA, and H3 substrate visualized by Western analysis. WCL, Western analysis of T288-phospho-AurA and total AurA in whole cell lysates (WCL). Bottom, change in proportion of MMTV-PyVT;Nedd9−/− cells with >2 centrosomes following expression of GFP (G) versus GFP-Nedd9 (G-Nedd9) or RFP (R) versus RFP-AurA (R-AurA) is insignificant (p>0.1).

