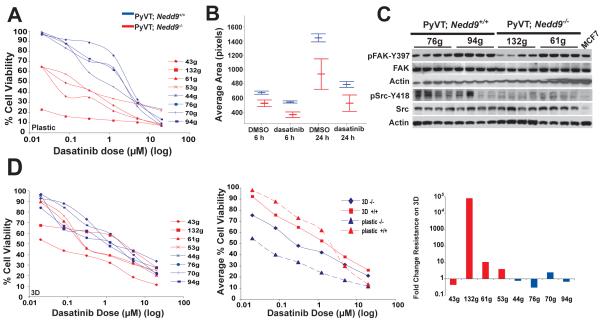
Figure 4. Response to dasatinib predicted by Nedd9 status and compensated by 3D TAF matrix.
A. IC50 curve calculations for 4 dasatinib-treated MMTV-PyVT;Nedd9−/− versus 4 MMTV-PyVT;Nedd9+/+ cell lines. Cell lines analyzed in quadruplicate, in 3 independent experiments. B. Comparative rate of attachment of MMTV-PyVT;Nedd9−/− versus MMTV-PyVT;Nedd9+/+ cell lines plated in dasatinib. Dasatinib-dependent decrease in spreading differs significantly at 6 (p=0.001) and 24 (p=0.016) hours. At 24 hours, proportionately fewer MMTV-PyVT;Nedd9−/− cells remain attached to plate (not shown). C. Immunoblots of tumor lysates prepared from tumors generated by mammary orthotopic reinjection of the cell line indicated at top. Each lane represents an independent tumor arising from the noted cell line. D. 3D TAF matrix rescues dasatinib sensitivity of MMTV-PyVT;Nedd9−/− cell lines. Left panel, experiment as in A, in 8 cell lines plated on 3D matrix generated from TAFs. Center, IC50 curves represented as averages, for genotypes and conditions indicated. Taking 1uM as an example, differences in IC50 between genotypes are significant on plastic (P=0.002) and on 3D TAF matrix (P=0.033). Right, fold difference in IC50 values for cell lines indicated in plating on TAF matrix versus tissue culture plastic.

