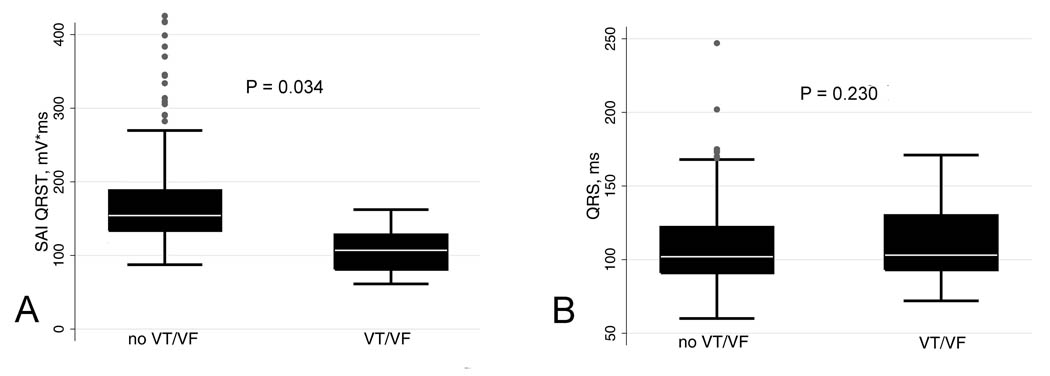
Figure 1.
Boxplot of baseline SAI QRST and QRS width in patients with and without VT/VF at follow-up. Median (white horizontal line crossing the box) and interquartile range [IQR] (box) of SAI QRST (A) and QRS width (B). Whiskers specify the adjacent values, defined as the most extreme values within 1.5 IQR of the nearer quartile.

