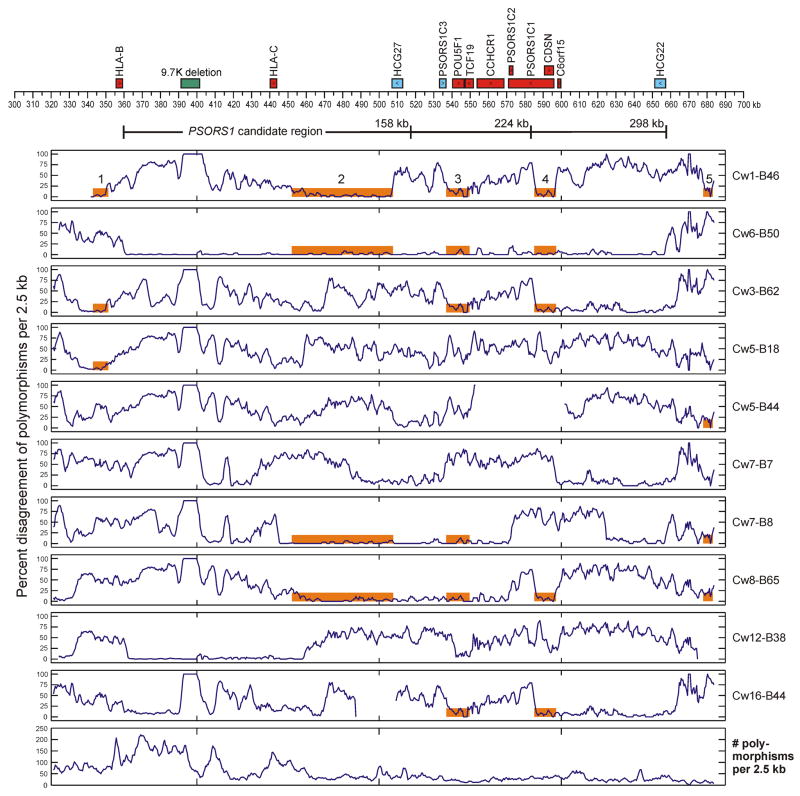
Figure 1.
Sequence comparison of ten MHC class I haplotypes with the HLA-Cw6-B57 risk haplotype. Known genes and their direction of transcription, as well as a 9.7-kb indel, are shown above the coordinate axis. Genes expressing non-coding RNA are colored cyan, and those expressing protein are colored red. Three delineations of the PSORS1 candidate region (Nair et al. 2006) are shown below the coordinate axis. The percent disagreement of polymorphism alleles, when compared with the HLA-Cw6-B57 haplotype, is plotted for each haplotype using a moving 2.5-kb window with a 500 bp lag. The bottom panel plots the number of polymorphisms that are variable among all sequenced haplotypes; only these polymorphisms were considered when computing percent disagreement. Regions of sequence homology at least 5 kb in length between the HLA-Cw1-B46 and HLA-Cw6-B57 haplotypes are mapped as five numbered orange bars in the top panel; these bars are also shown on all other haplotypes sharing the same regions of homology.

