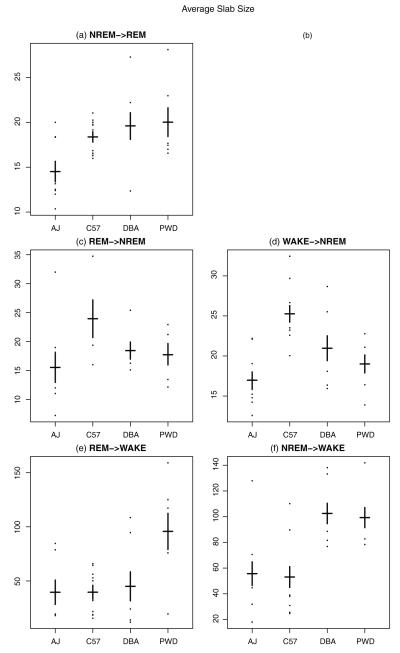
Fig. 8.
On y-axis proposed measure μ, the average slab size in units of 4-s epochs, for each mouse by strain. (a) Gives μ for REM followed from NREM; (b) is left empty, i.e., REM following from WAKE; (c) gives μ for NREM followed from REM; (d) gives μ for NREM followed from WAKE; (e) gives μ for WAKE followed from REM; (f) gives μ for WAKE followed from NREM. Means for each strain are indicated by the horizontal black line and standard errors by the vertical bars.

