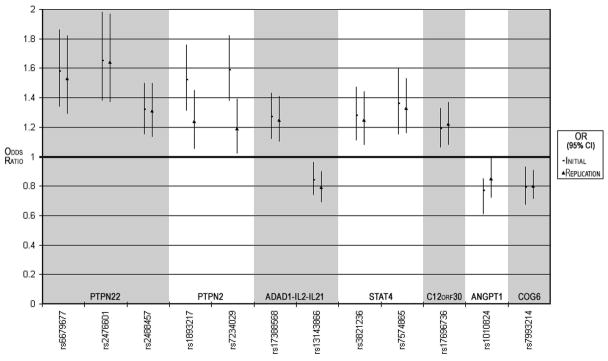
Figure 1.
Consistent findings for case-control association results of variants from initial and replication JIA cohorts are illustrated. Odds ratios (OR) correspond to data from the initial and replication cohorts are indicated by the symbols “-” and “Δ”, respectively; 95% confidence intervals (95% CIs) for these OR are indicated by vertical lines. Individual SNP variants are grouped by genetic loci.

