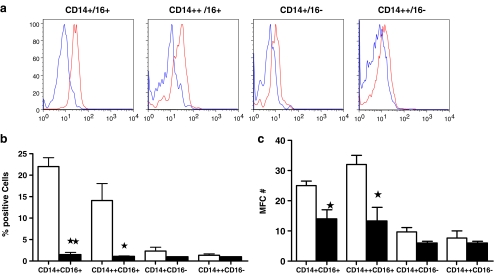
Fig. 3.
Expression of TLR1 on four subsets of monocytes in young and aged subjects. Each subset of monocytes was gated, and proportions of each subset with TLR1 expression were expressed as percent of a particular subset of monocyte. a Representative cytofluorograph from a young subject, b cumulative data for the proportions of TLR-1+ subsets, and c the fluoresecence intensity of TLR1 (mean fluorescence channel number (MFC#)) of TLR-1 in each subset of monocytes from young and aged subjects

