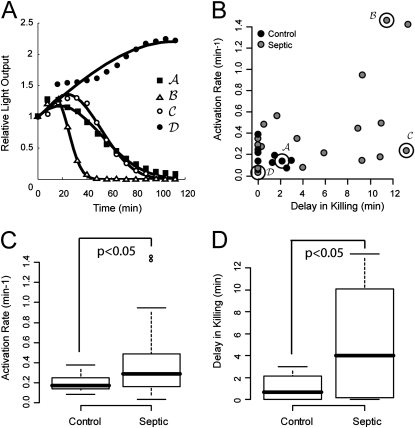
Figure 4.
Analysis of bacterial killing capacity in healthy volunteers and patients with sepsis. (A) Representative luminescence tracings of four subjects, one healthy and three severely septic, illustrating the differences in patterns seen. Tracing labels carry over to the scatter plot in B. (B) Plot of all observed activation rates and delays among the 30 subjects studied. (C and D). Box plots representing the 5th, 25th, 50th, 75th, and 95th percentile of parameter estimates for activation rate (per minutes) and delay (in minutes) between healthy (n = 10) and patients with severe sepsis (n = 20). Dots represent values outlying more than 2 SD from the sample mean. The groups were statistically different by t tests, although the results were unexpected: Most septic patients showed evidence of faster activation than the control subjects, suggesting up-regulation of complement effects or loss of regulatory function in the pathway.

