
Figure 2.
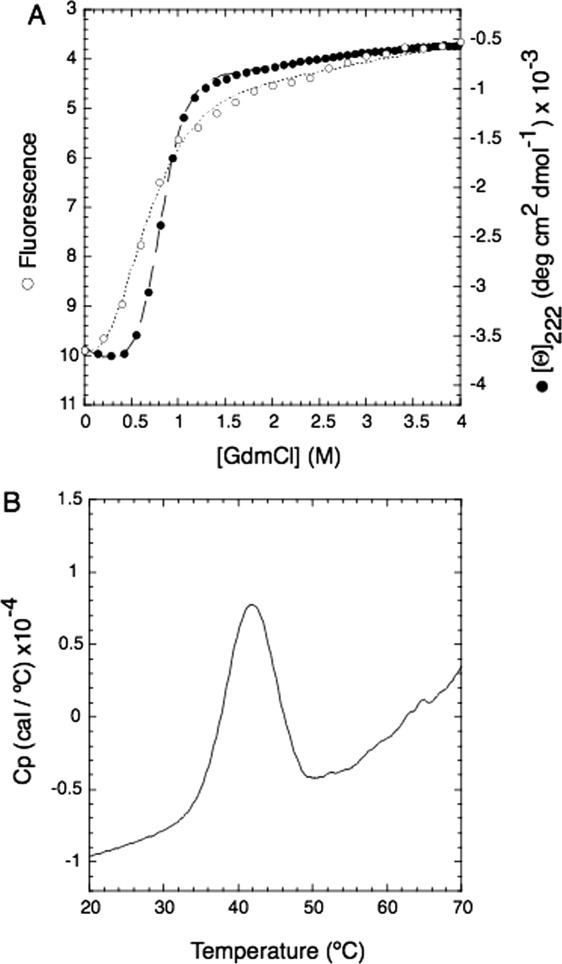
Thermodynamic stability of the FYR domain. A: Denaturation curves of a fragment of TBRG1 that encompasses the FYRN and FYRC motifs fitted to a two-state model following the intrinsic fluorescence of tryptophan (left: y-axis; white circles, dotted line) and molar ellipticity at 222 nm (right: y-axis; black circles, dashed line) as a function of [GdmCl]. B: Thermal denaturation of the same protein monitored by DSC. The apparent melting temperature (Tm) is 41.8°C.